
Selected Work from Projects

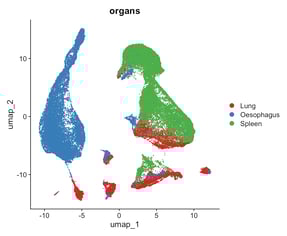
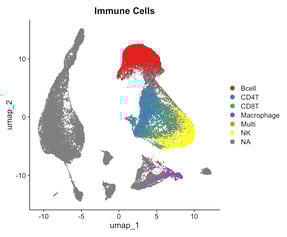
Single Cell UMAP & Cell Type Annotation
Visualize and interpret cellular diversity by embedding cells in 2D/3D space and labeling them based on known (left) or predicted (right) cell types
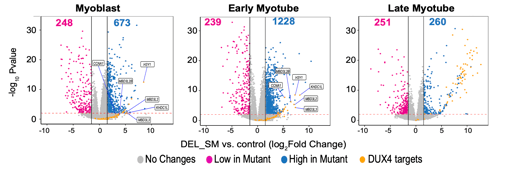
Volcano Plot
Key visualization tool in transcriptomics that displays the results of differential gene expression analysis, combining both the magnitude of change and statistical significance in a single plot
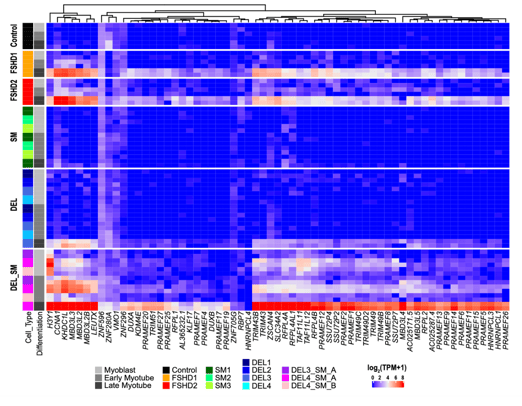
A gene expression heatmap with bar annotations for sample grouping is a powerful visualization used to show how a set of genes (or gene signature) is expressed across multiple samples, while also indicating the biological or experimental groups those samples belong to
Gene Expression Heatmap
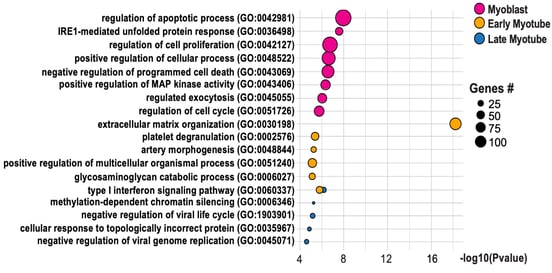
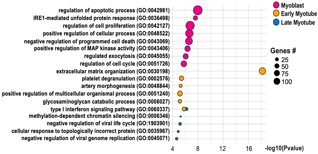
Gene Ontology
Gene Ontology (GO) is a standardized framework for describing the functions, biological roles, and cellular locations of genes and their products across species
Transcriptomics
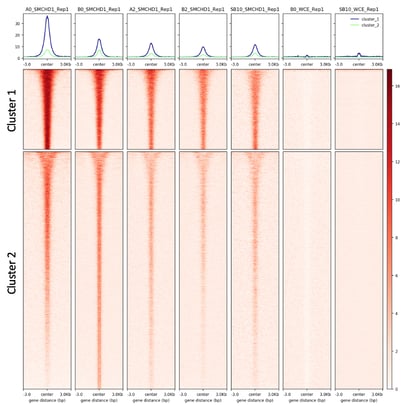
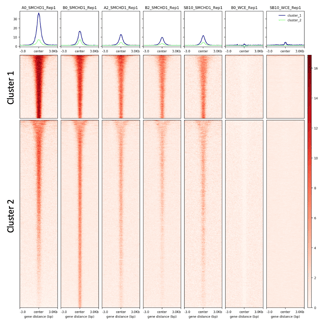
A genomic heatmap of epigenetic signal across defined genomic regions (e.g., promoters, enhancers, peak centers), where each signal profile is aligned and visualized over a consistent window (e.g., ±3 kb) to reveal patterns of chromatin accessibility, protein-DNA interactions, or histone modifications across the genome.
Epigenetic Signal Heatmap
Epigenomics
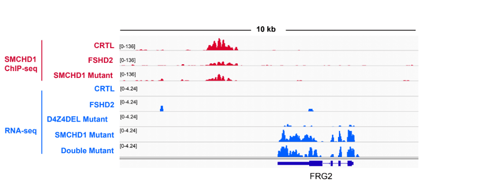
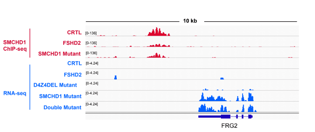
Peak visualization is a powerful, interactive tool used to visualize genomic features such as ChIP-seq/CUT&RUN/ATAC-seq peaks and RNA-seq expression side-by-side at specific loci.
Peak Signal Visualization

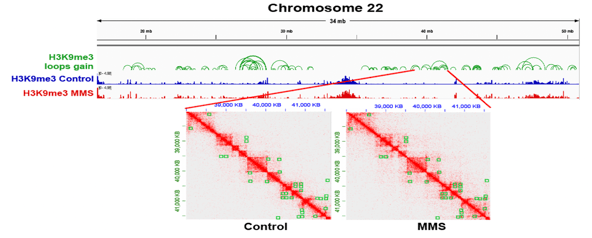
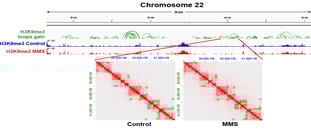
Mapping of HiC Interaction
A HiC interaction heatmap visualizes pairwise chromatin contact frequencies across the genome
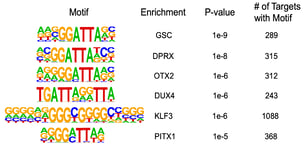
Motif analysis: computational method used to identify short, recurring DNA or RNA sequences (called motifs) that are often associated with regulatory functions, such as transcription factor binding sites or RNA-binding protein targets.
Motif Analysis